Understanding Metrics by Cohort (Advanced Analytics)
Understanding Metrics by Cohort (Advanced Analytics)
QuickMail's Advanced Analytics gives a deep dive into email effectiveness, offering insights into the actual deliverability of emails sent from your email account or a campaign based on email stats.
If you want to see how revolutionary that is, here is an article from our founder explaining why our metrics are unique: https://www.linkedin.com/pulse/why-were-all-wrong-open-rates-jeremy-chatelaine-/
In this article:
Where can I find Metrics by cohort?
What are the types of data in the analytics?
Absolute vs. percentage
Understanding Metrics by cohort
Why do my stats look off when I manually calculate them?
Can we have a LinkedIn-specific dashboard?
Can I see how many emails have been sent per user?
Where Can I Find Metrics by Cohort?
There are two ways to see Metrics by Cohort in QuickMail.
Overall Metrics
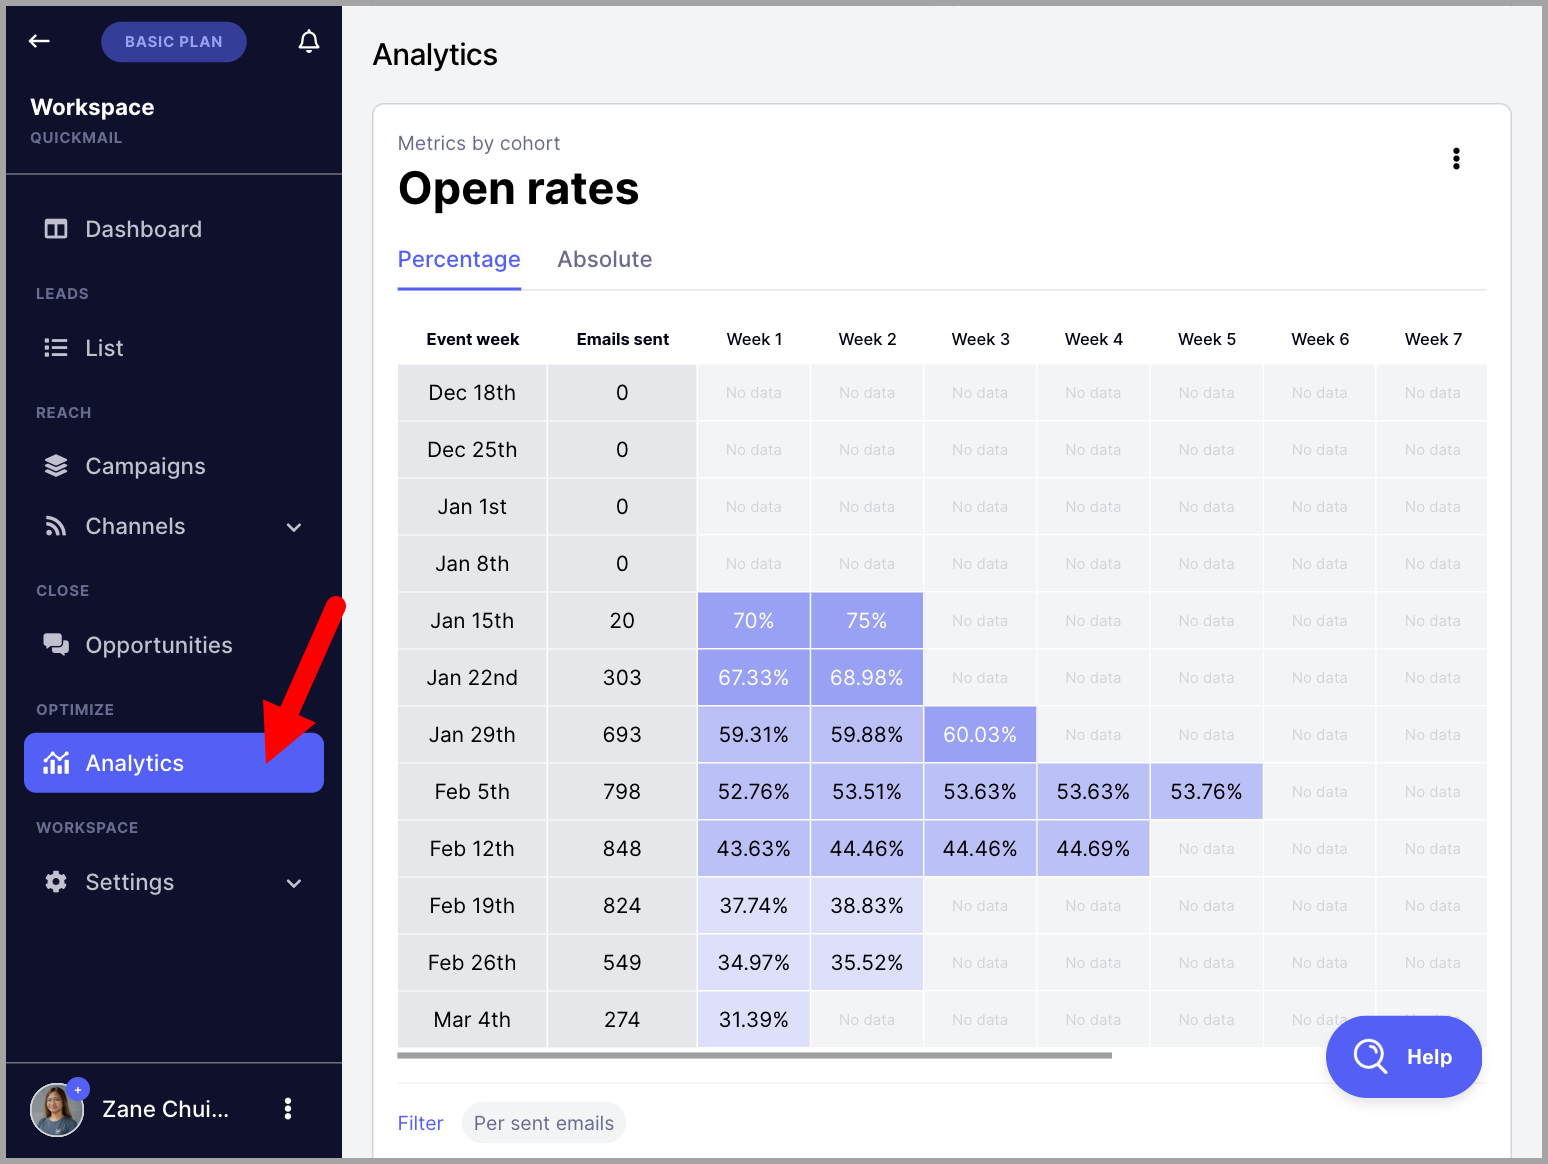
The overall metrics by cohort can be found on the Analytics page.
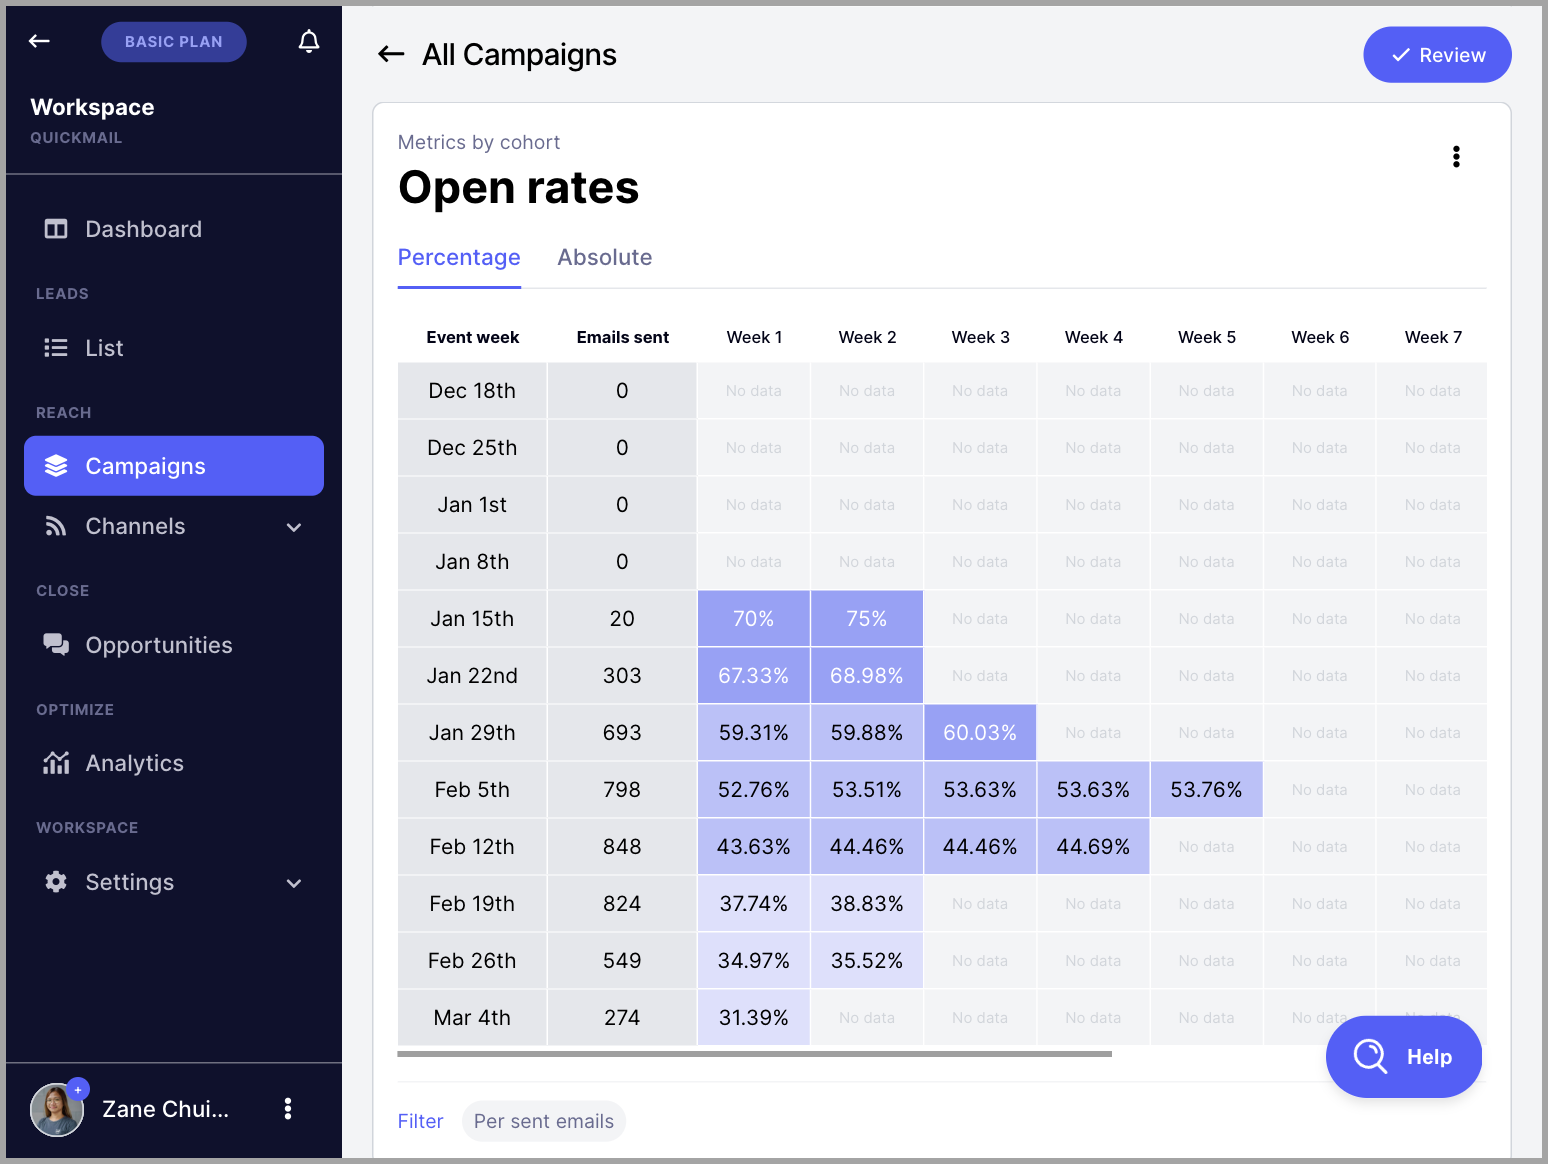
Per Campaign
The metrics per campaign can be found on the dashboard of each campaign.
Go to the Campaigns page → select a campaign → scroll down to see the metrics by cohort.
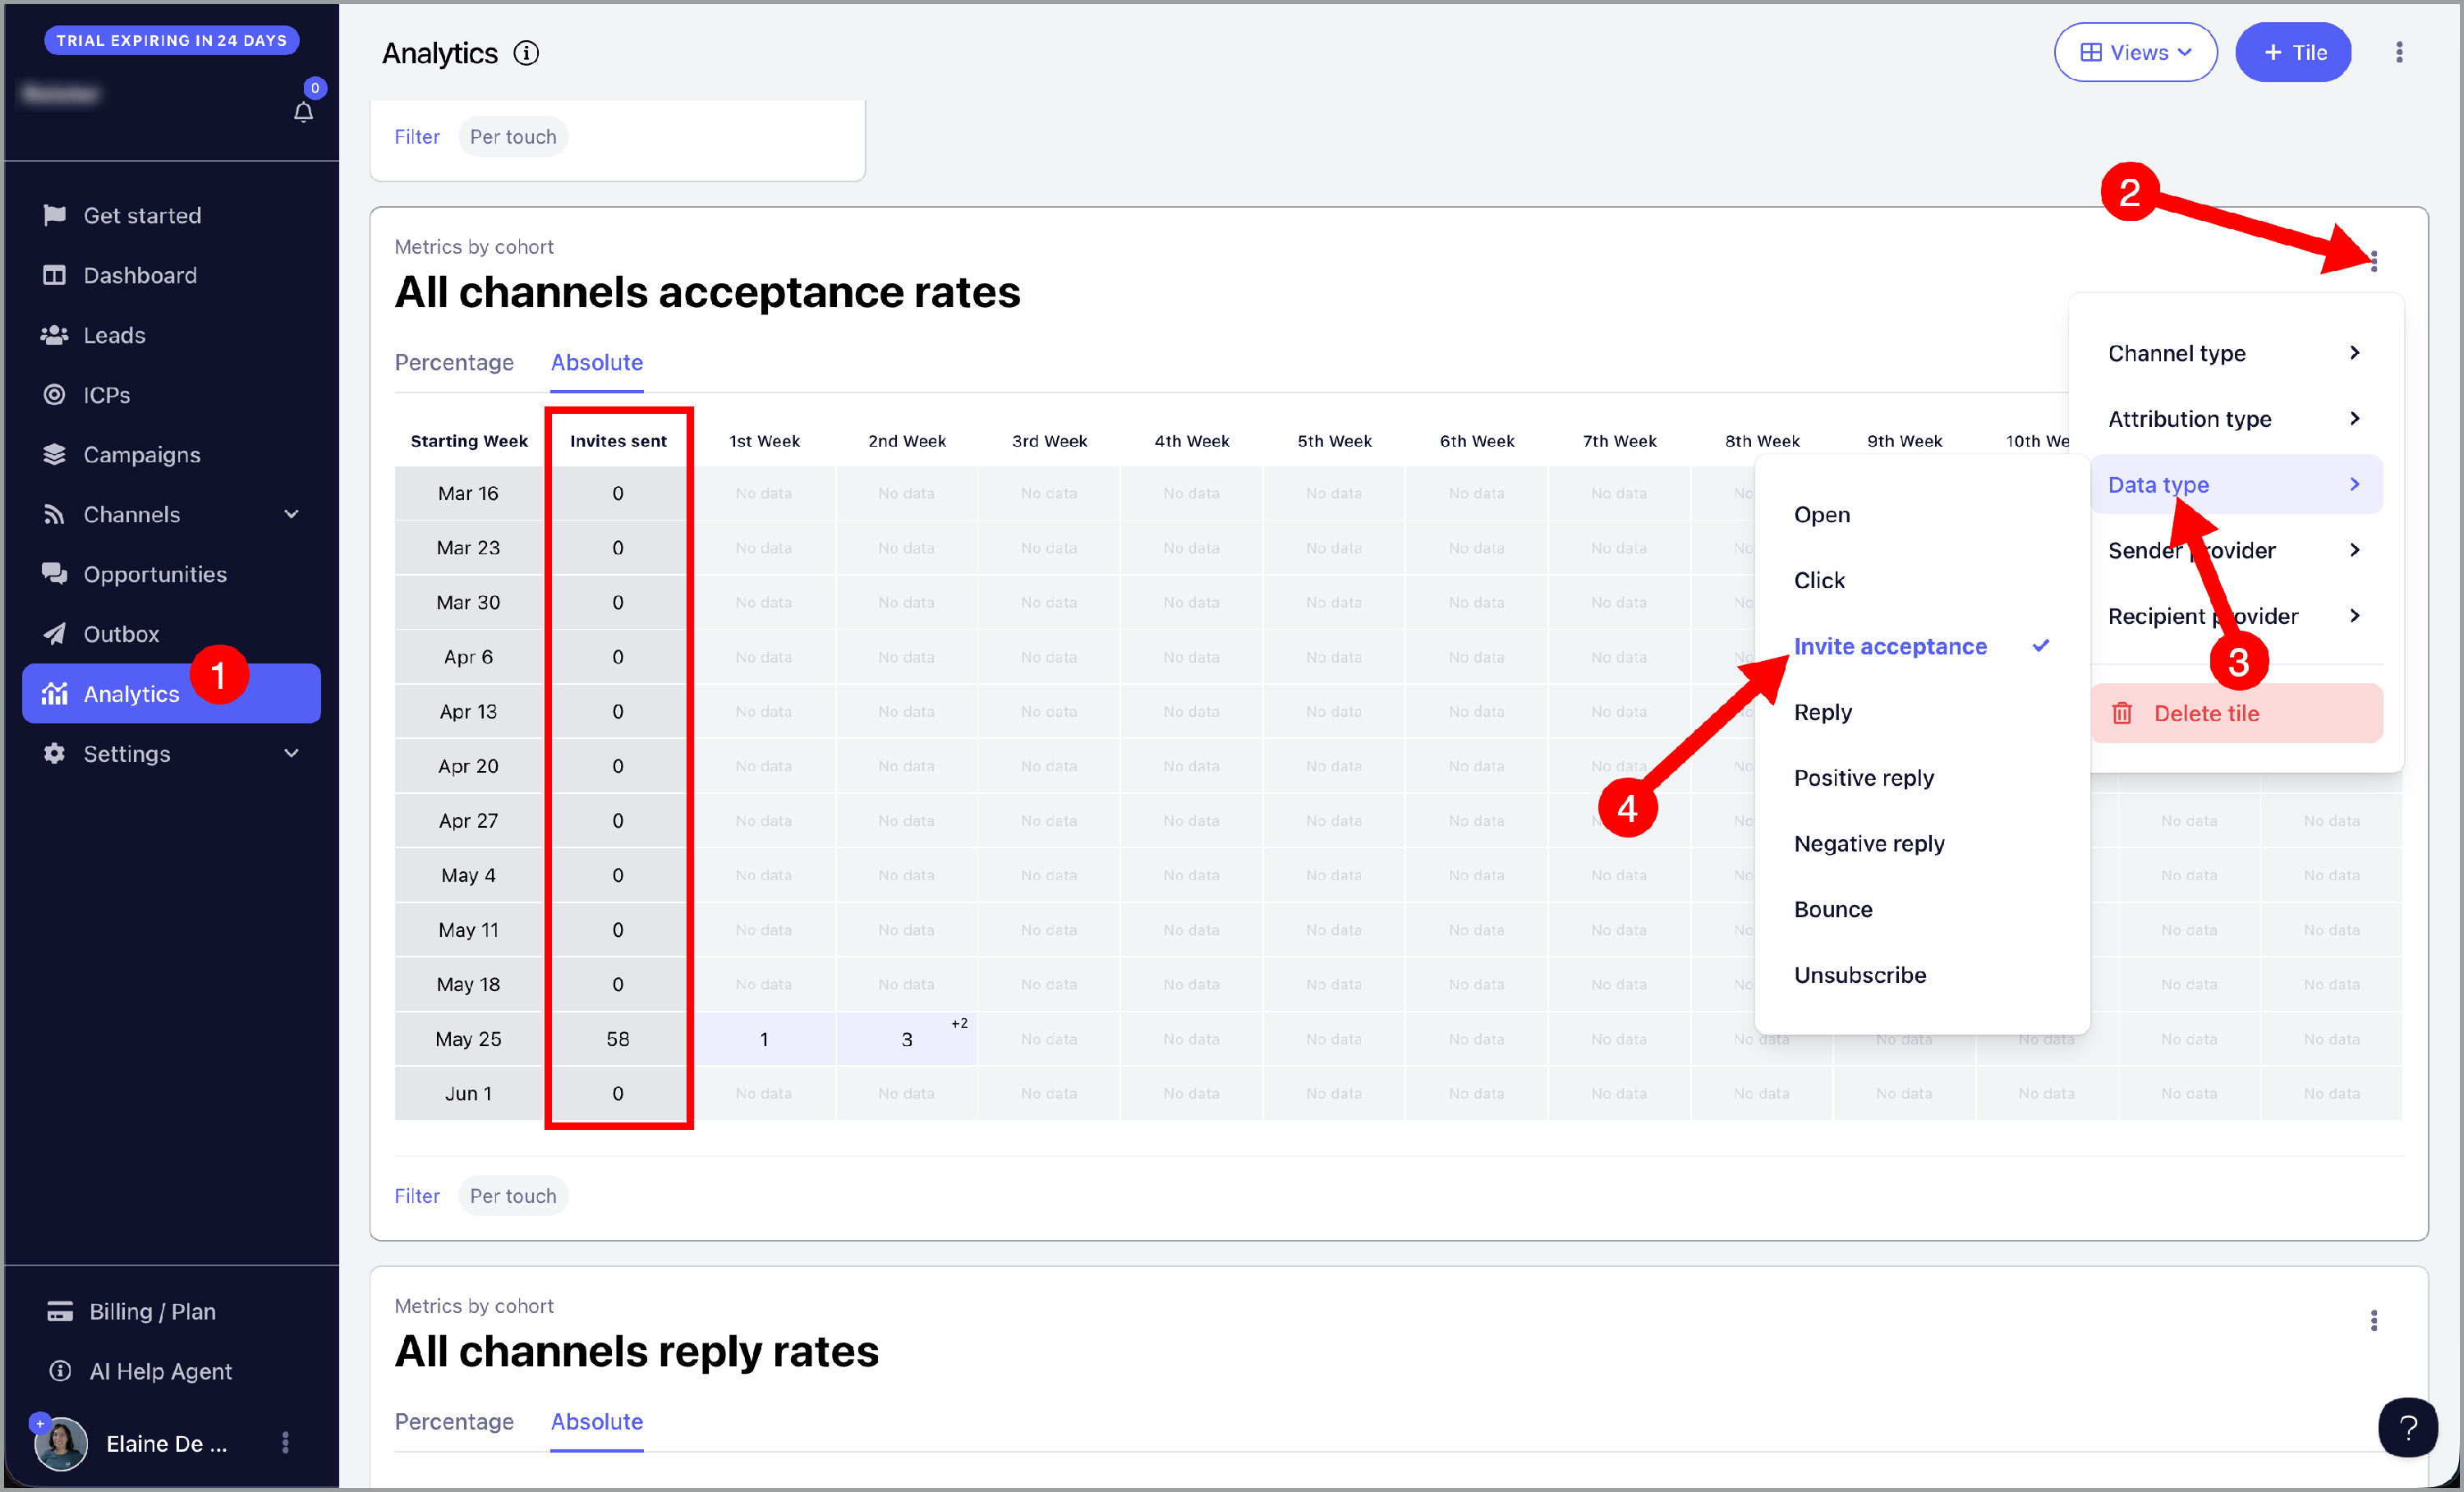
What Are the Types of Data in the Analytics?
Data Type
The available data in the metrics includes:
Opens
Clicks
Replies
Positive and negative replies (based on reply categorization)
Bounces
Unsubscribes
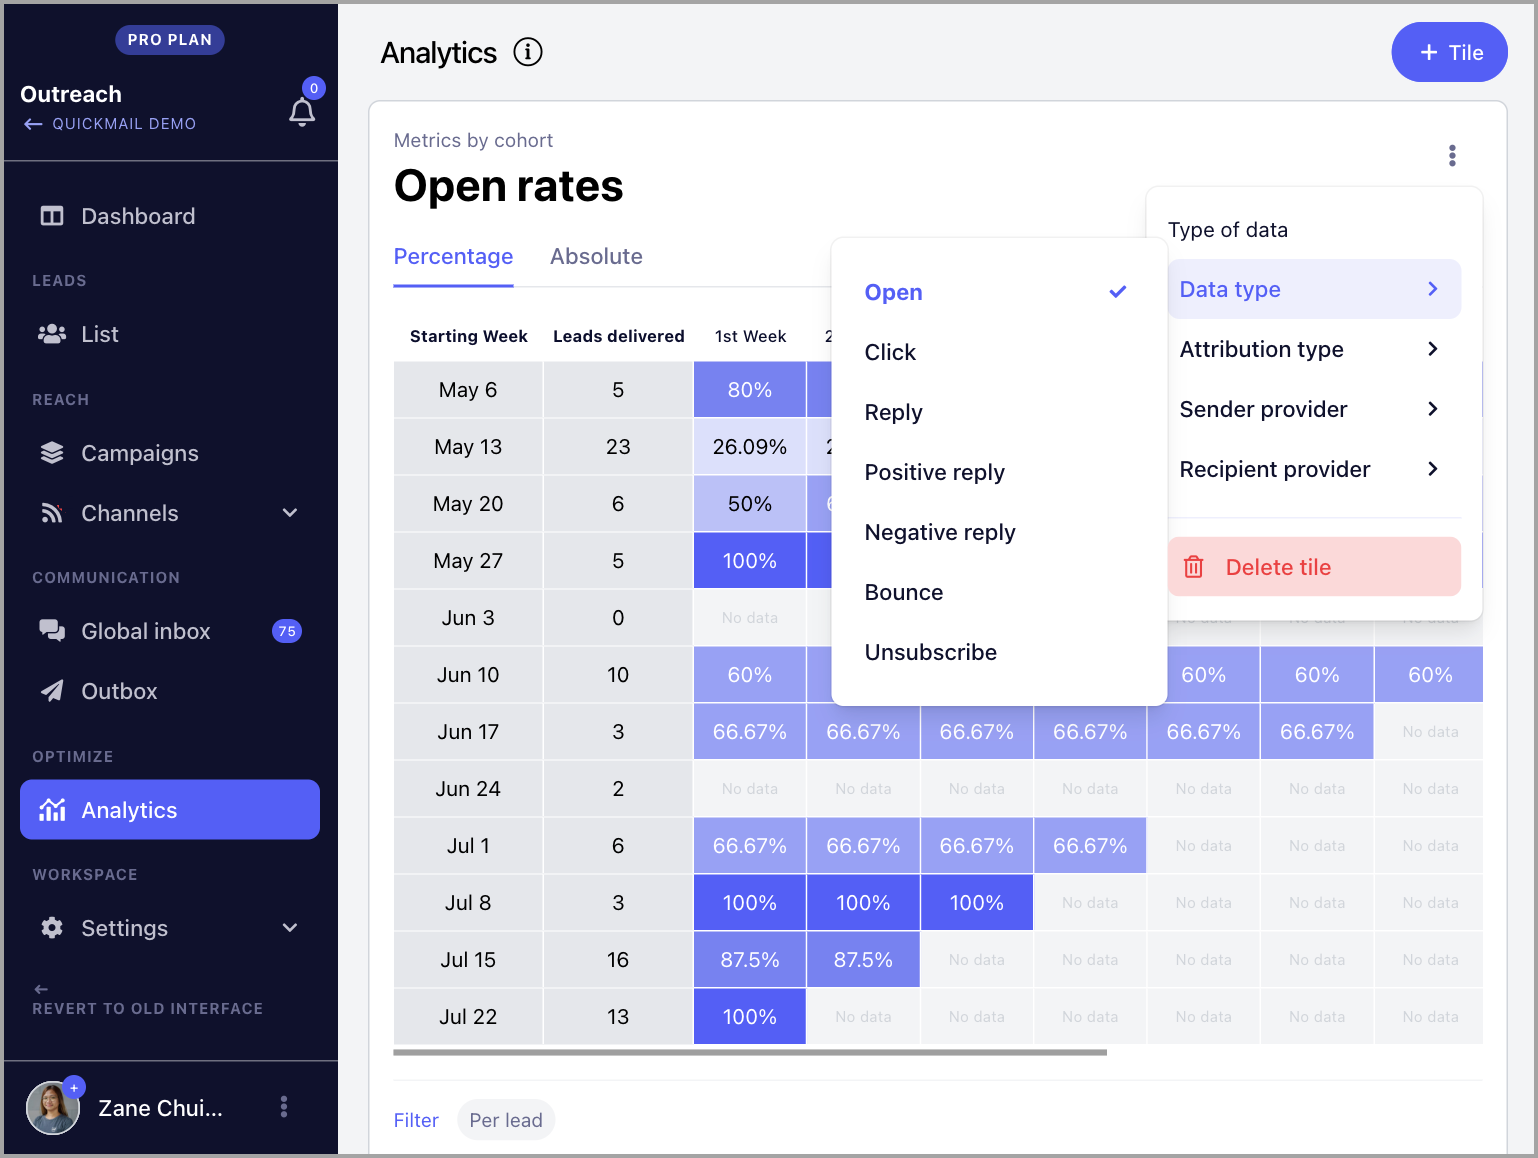
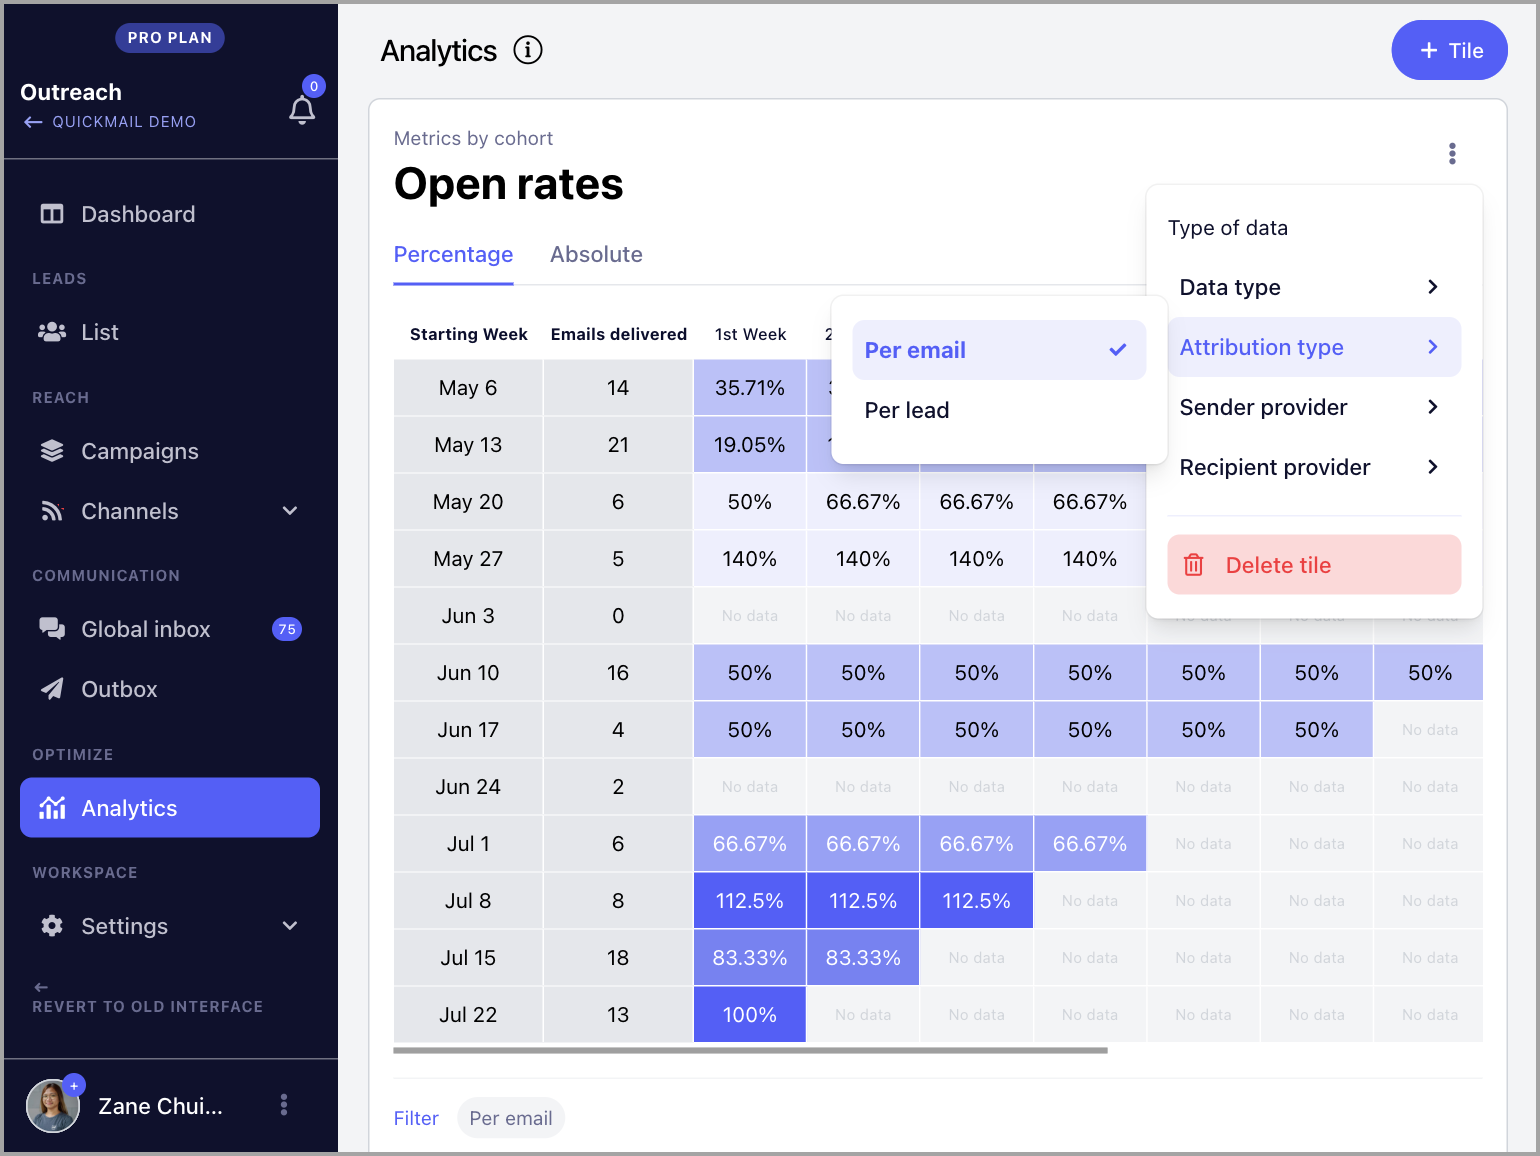
Attribution Type
Data can be viewed based on either:
Number of emails sent
Number of leads started
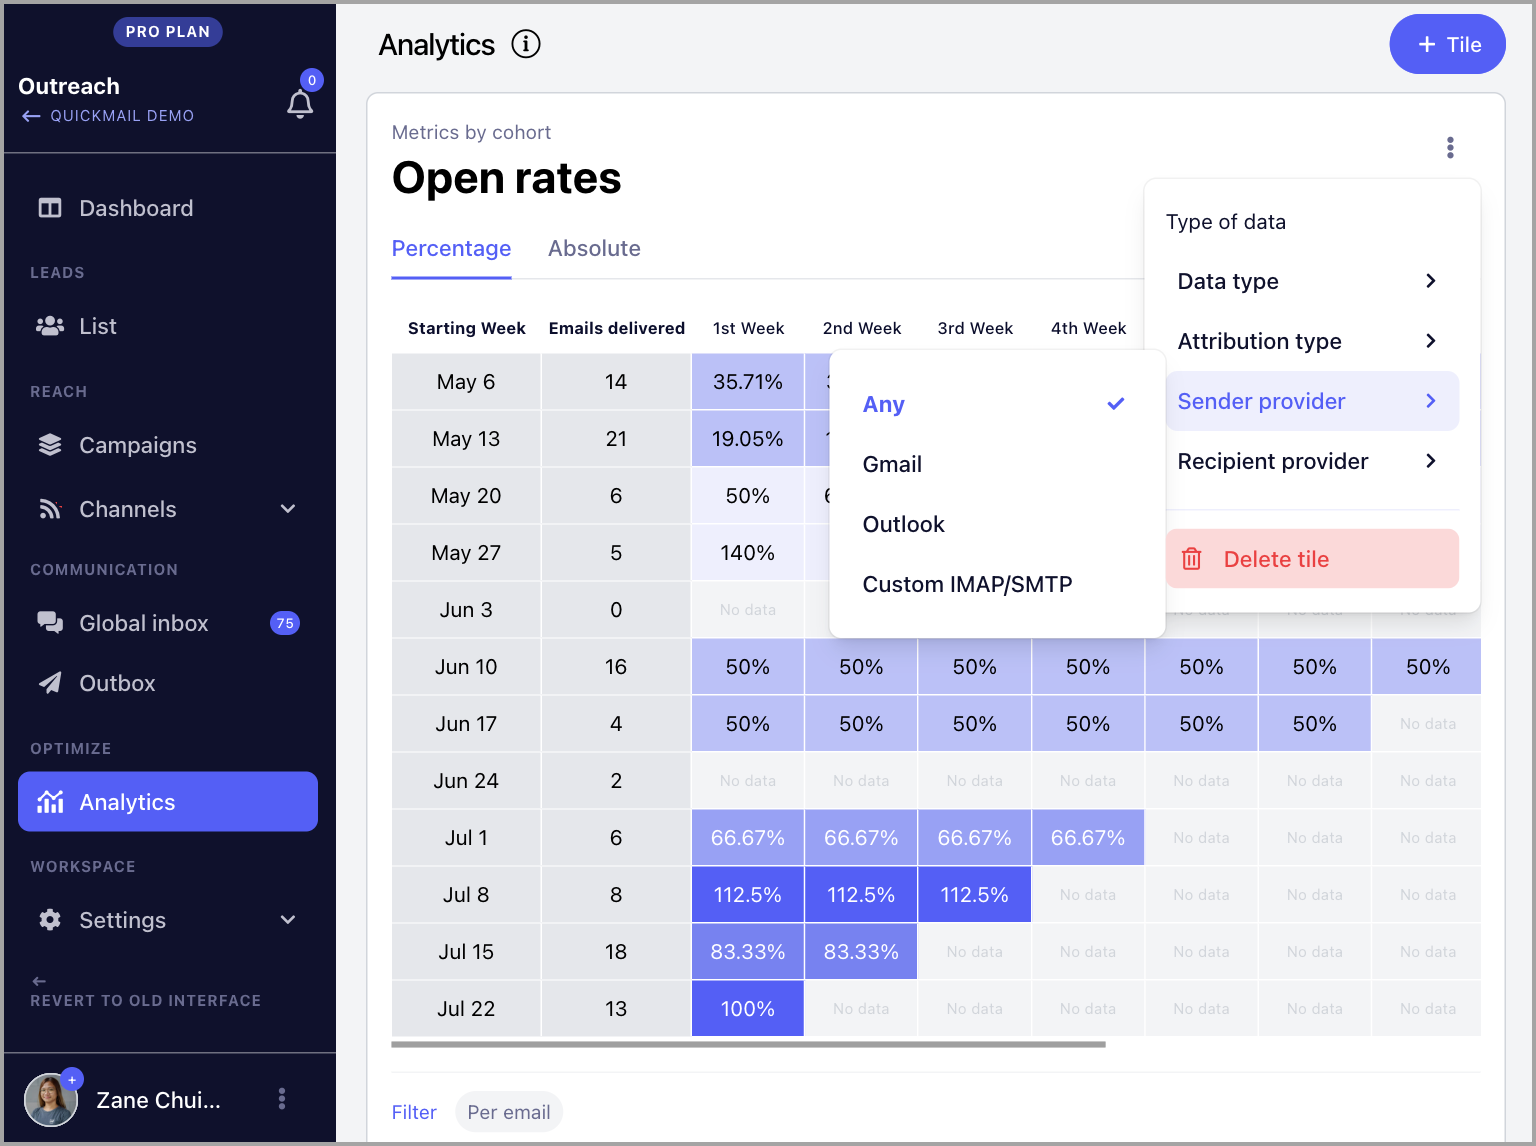
Sender Provider
Data can also be filtered by the email provider of the sending email account:
Gmail
Outlook
Custom IMAP/SMTP
Any
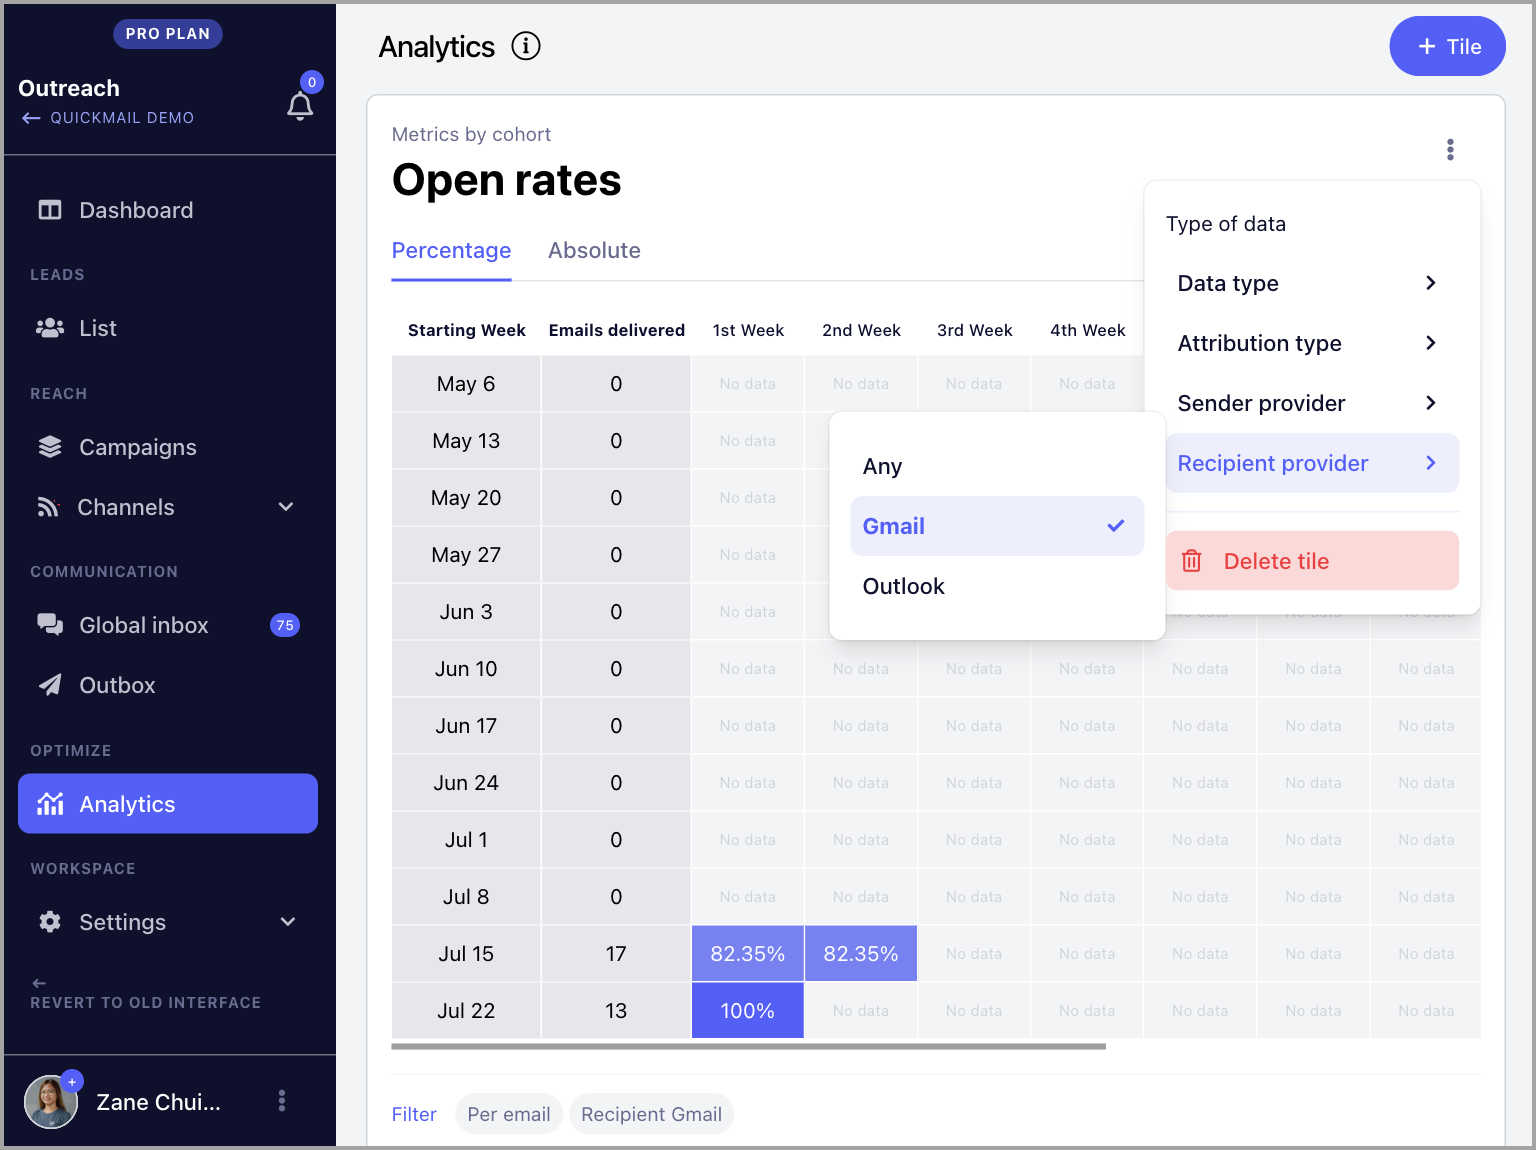
Recipient Provider
Data can also be filtered by the recipient's email provider:
Gmail
Outlook
Any
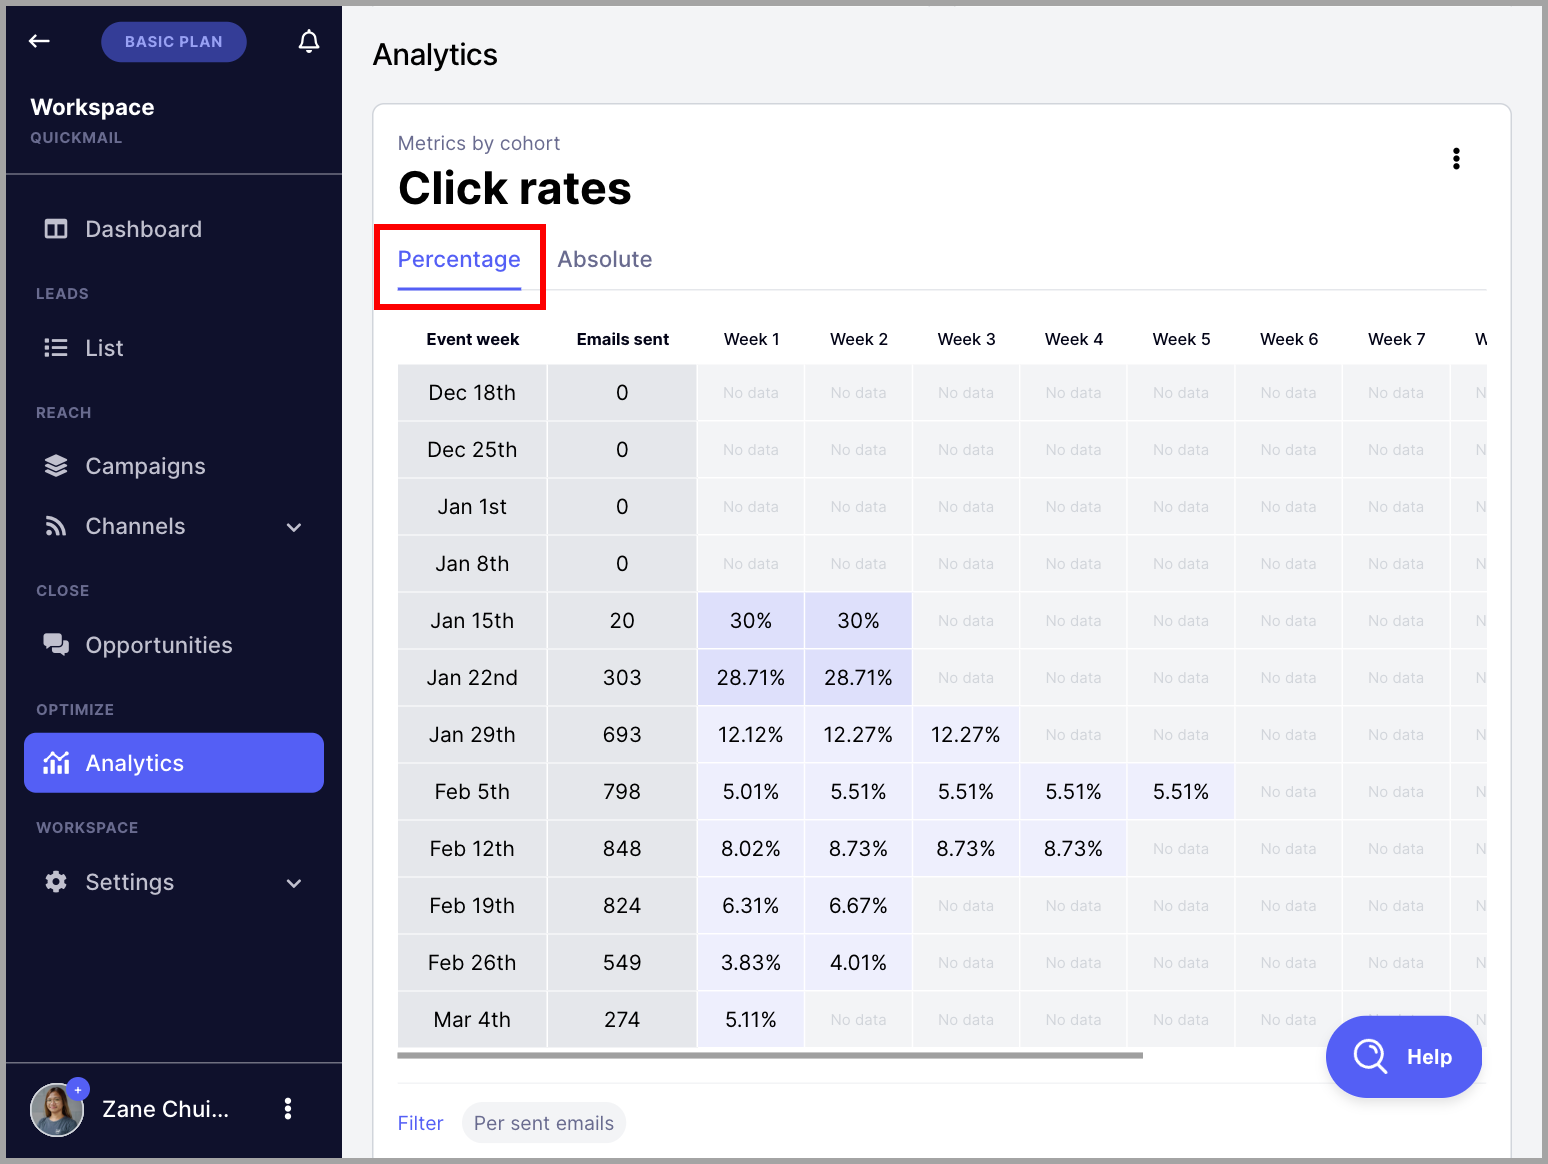
Absolute vs. Percentage
Percentage
The default view is in percentage, which expresses values as a proportion of the whole per statistic.
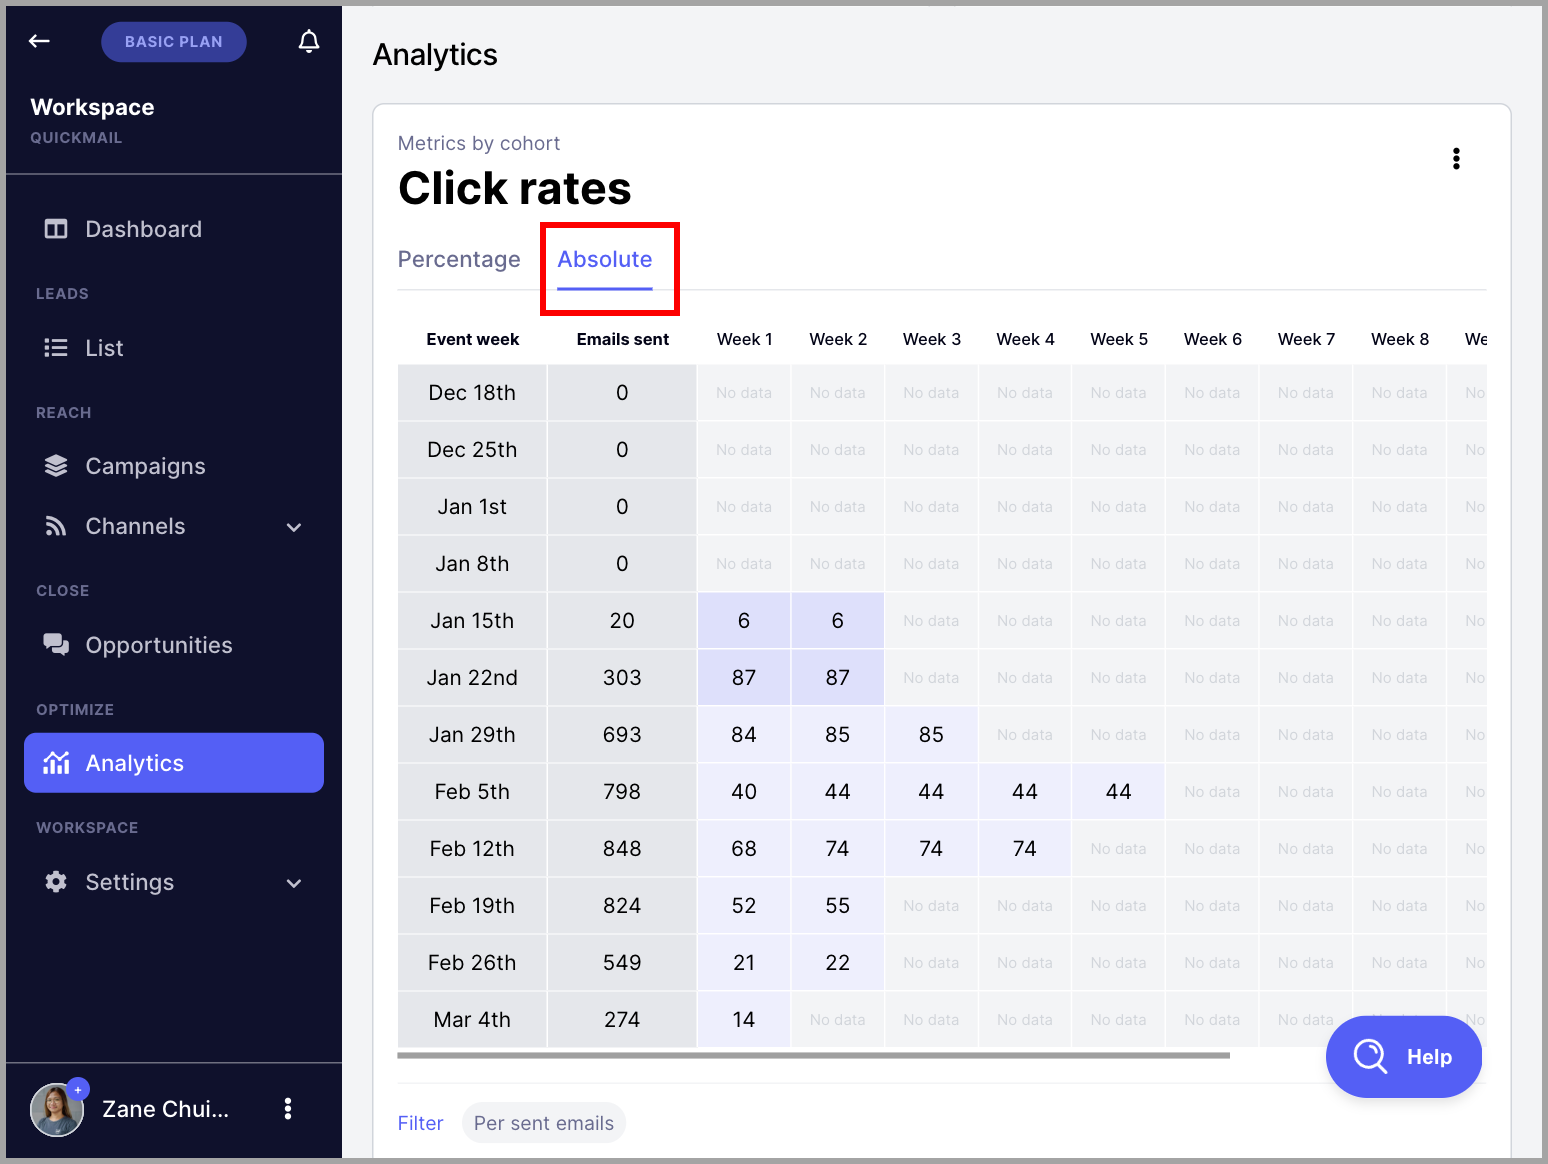
Absolute
Absolute metrics represent the numerical values of the tracked statistics.
Understanding Metrics by Cohort
Metrics for opens, replies, positive replies, negative replies, and unsubscribes are attributed to the date the email was sent or when the journey started each week, rather than only the date the event occurred.
Here is what each column means:
Event Week — the week the journeys started or the emails were initially sent.
Emails Sent / New Journeys — the number of new journeys or emails sent in the event week.
Week 1 — the open, click, reply, bounce, or unsubscribe rate in the event week.
Week 2 and subsequent weeks — the open, click, reply, bounce, or unsubscribe rate in subsequent weeks, still attributed to the journey or emails sent in the event week.
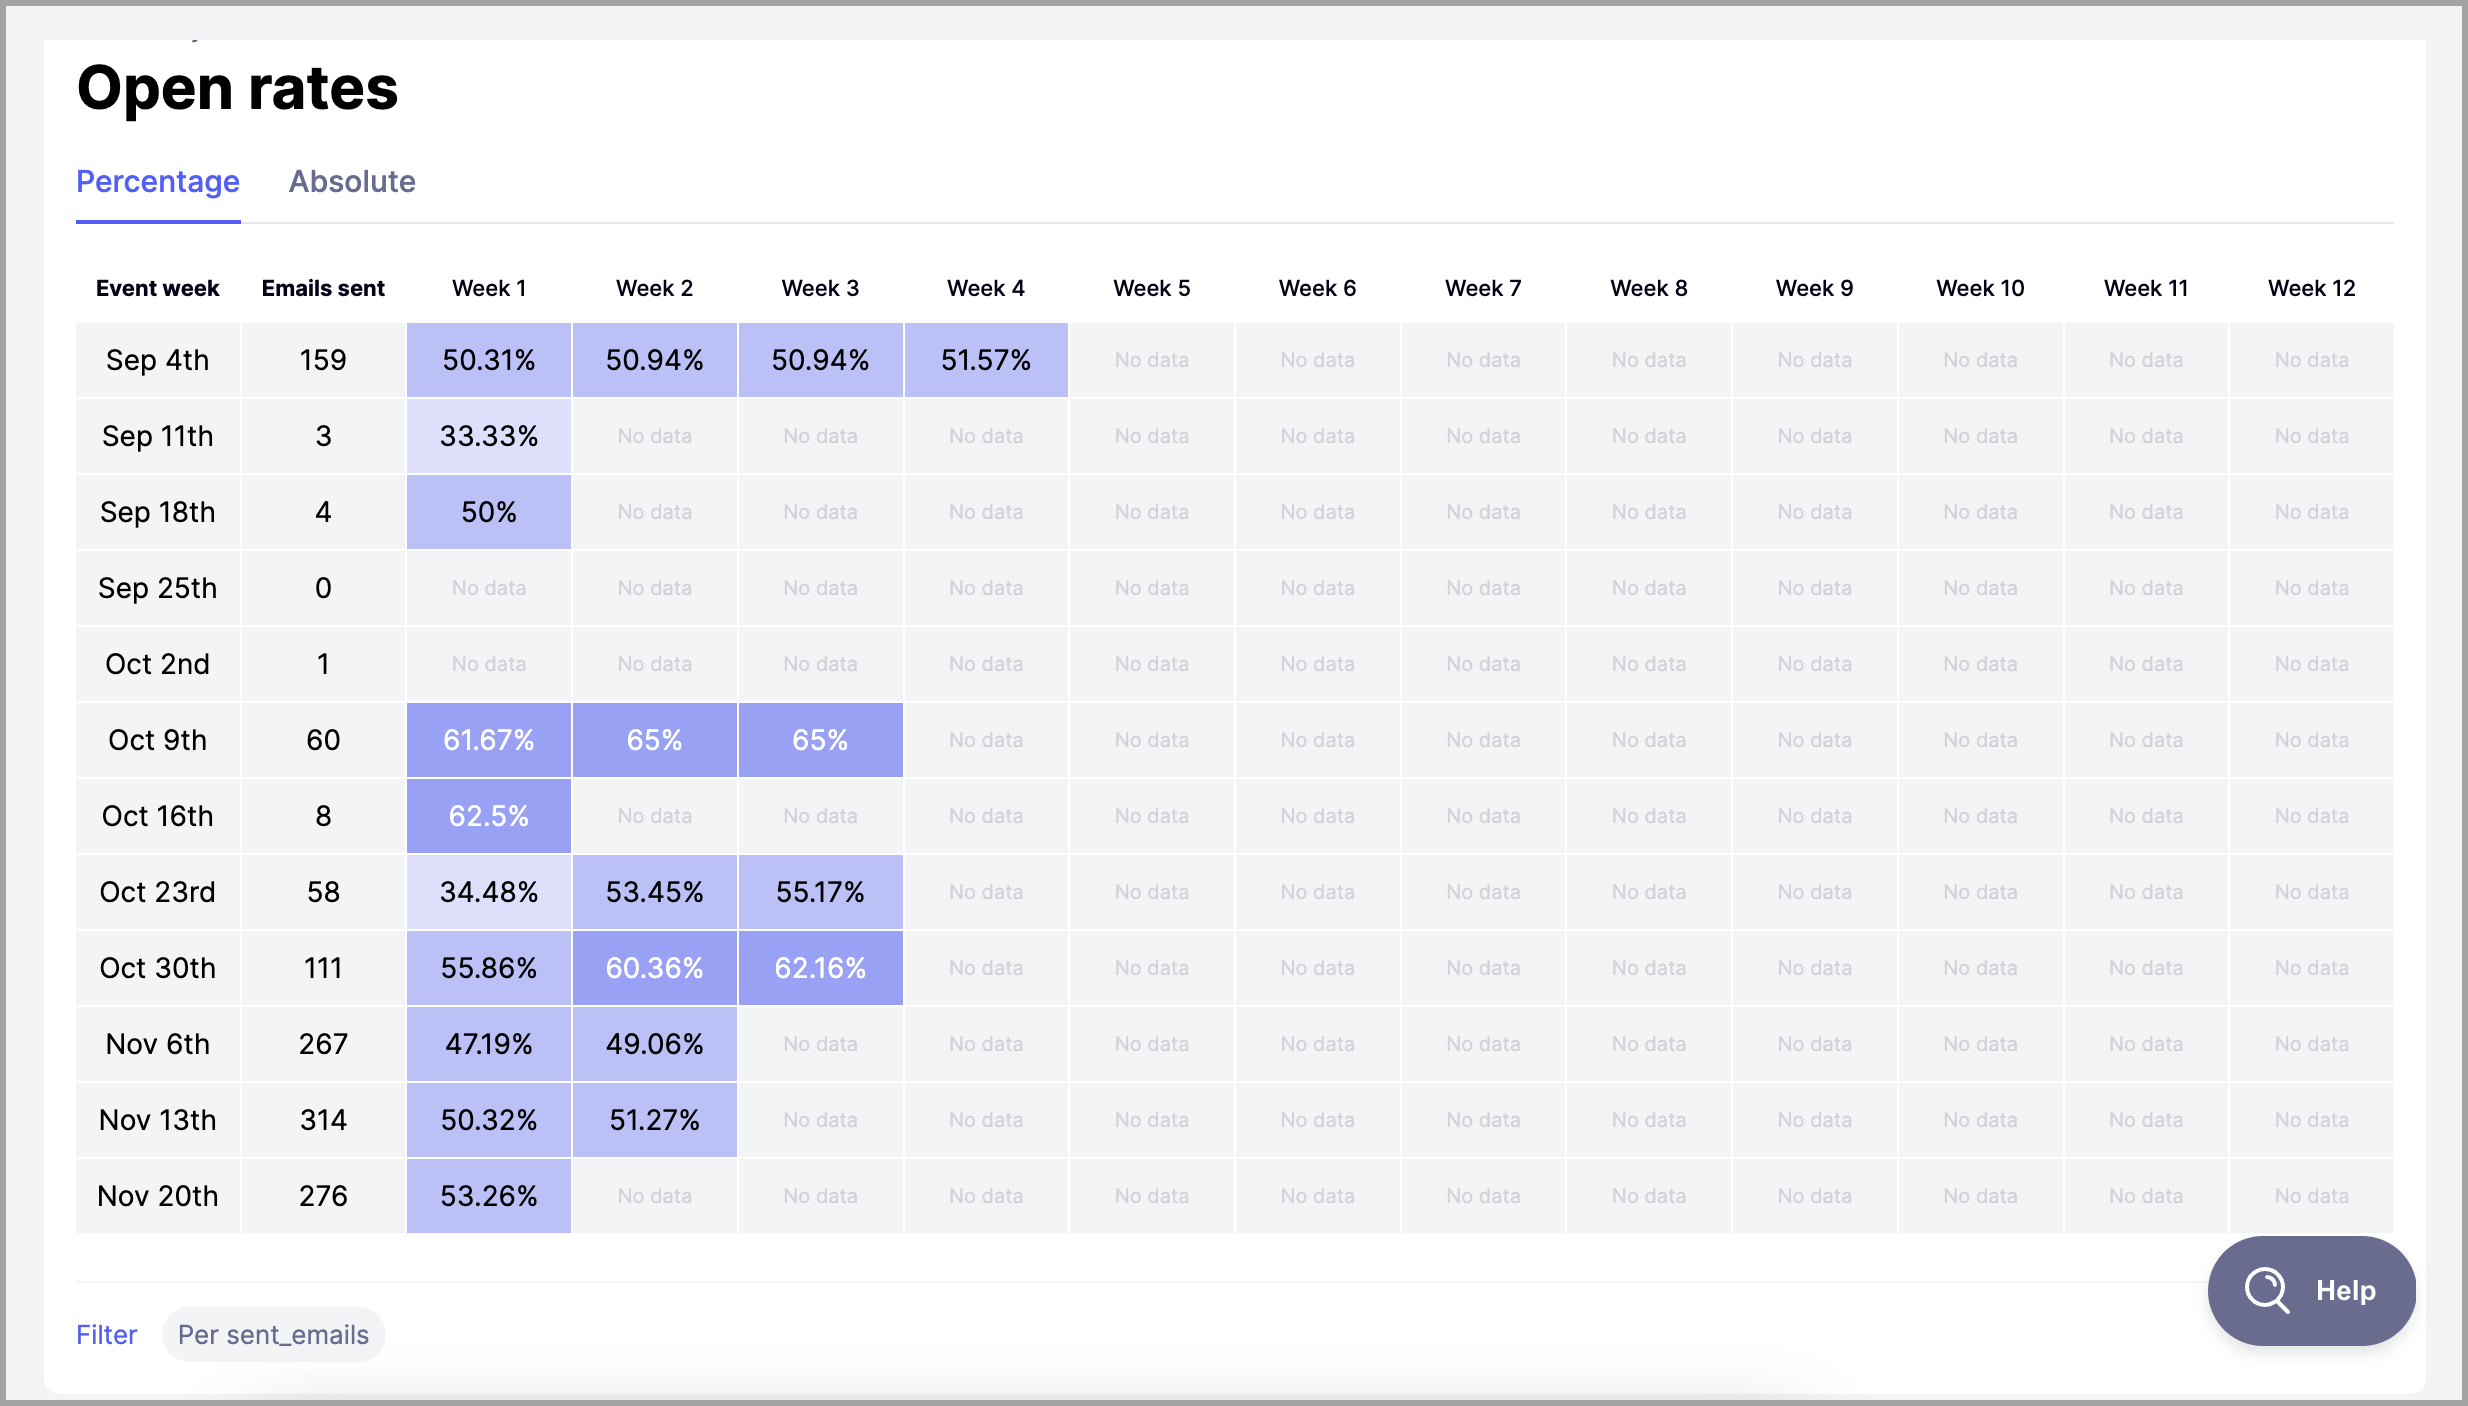
To better understand how analytics work, here is an example using the open rate based on the number of emails sent for the week of October 9th in the image above.
For the week of September 4th, the total number of emails sent was 19. In the same week, the open rate was 50.31%.
The following week, the open rate increased to 50.94%.
There were no additional opens the week after, so the open rate remained at 50.94% in week 3.
The last open was detected in week 4, which increased the open rate to 51.57%.
In summary, the open rate of emails sent in the week of September 4th increased from 50.31% to 51.57% over 5 weeks. This also means that more than 51.57% of the emails were delivered.
Why Do My Stats Look Off When I Manually Calculate Them?
If the numbers you calculate manually do not match what QuickMail is showing, the most common reason is deleted leads.
How QuickMail handles deleted leads:
When you delete a lead from a campaign or your account, QuickMail preserves the historical performance data from that lead.
This means:
The lead is removed from your active lead list.
But their stats remain in the campaign's overall analytics (opens, clicks, replies, etc.)
This prevents your campaign performance history from changing retroactively. If you sent 100 emails and got 25 opens, then deleted 20 leads, your open rate should still reflect the original 25 opens — not recalculate as if those 20 leads never existed.
Example:
Your campaign shows:
50 opens
200 emails sent
25% open rate
But when you count your current leads manually:
Only 40 leads in the campaign
Each received 4 emails = 160 total emails
The gap: 200 - 160 = 40 emails were sent to leads that have since been deleted, but their stats are still counted in your campaign analytics.
Can We Have a LinkedIn-Specific Dashboard?
InMail, profile views, and messages all fall under LinkedIn touches. There is currently no option for a specific view for them.
To check how many InMails, profile views, or messages were sent, look at the Outbox and filter manually. Note that the Outbox only shows the last 30 days.
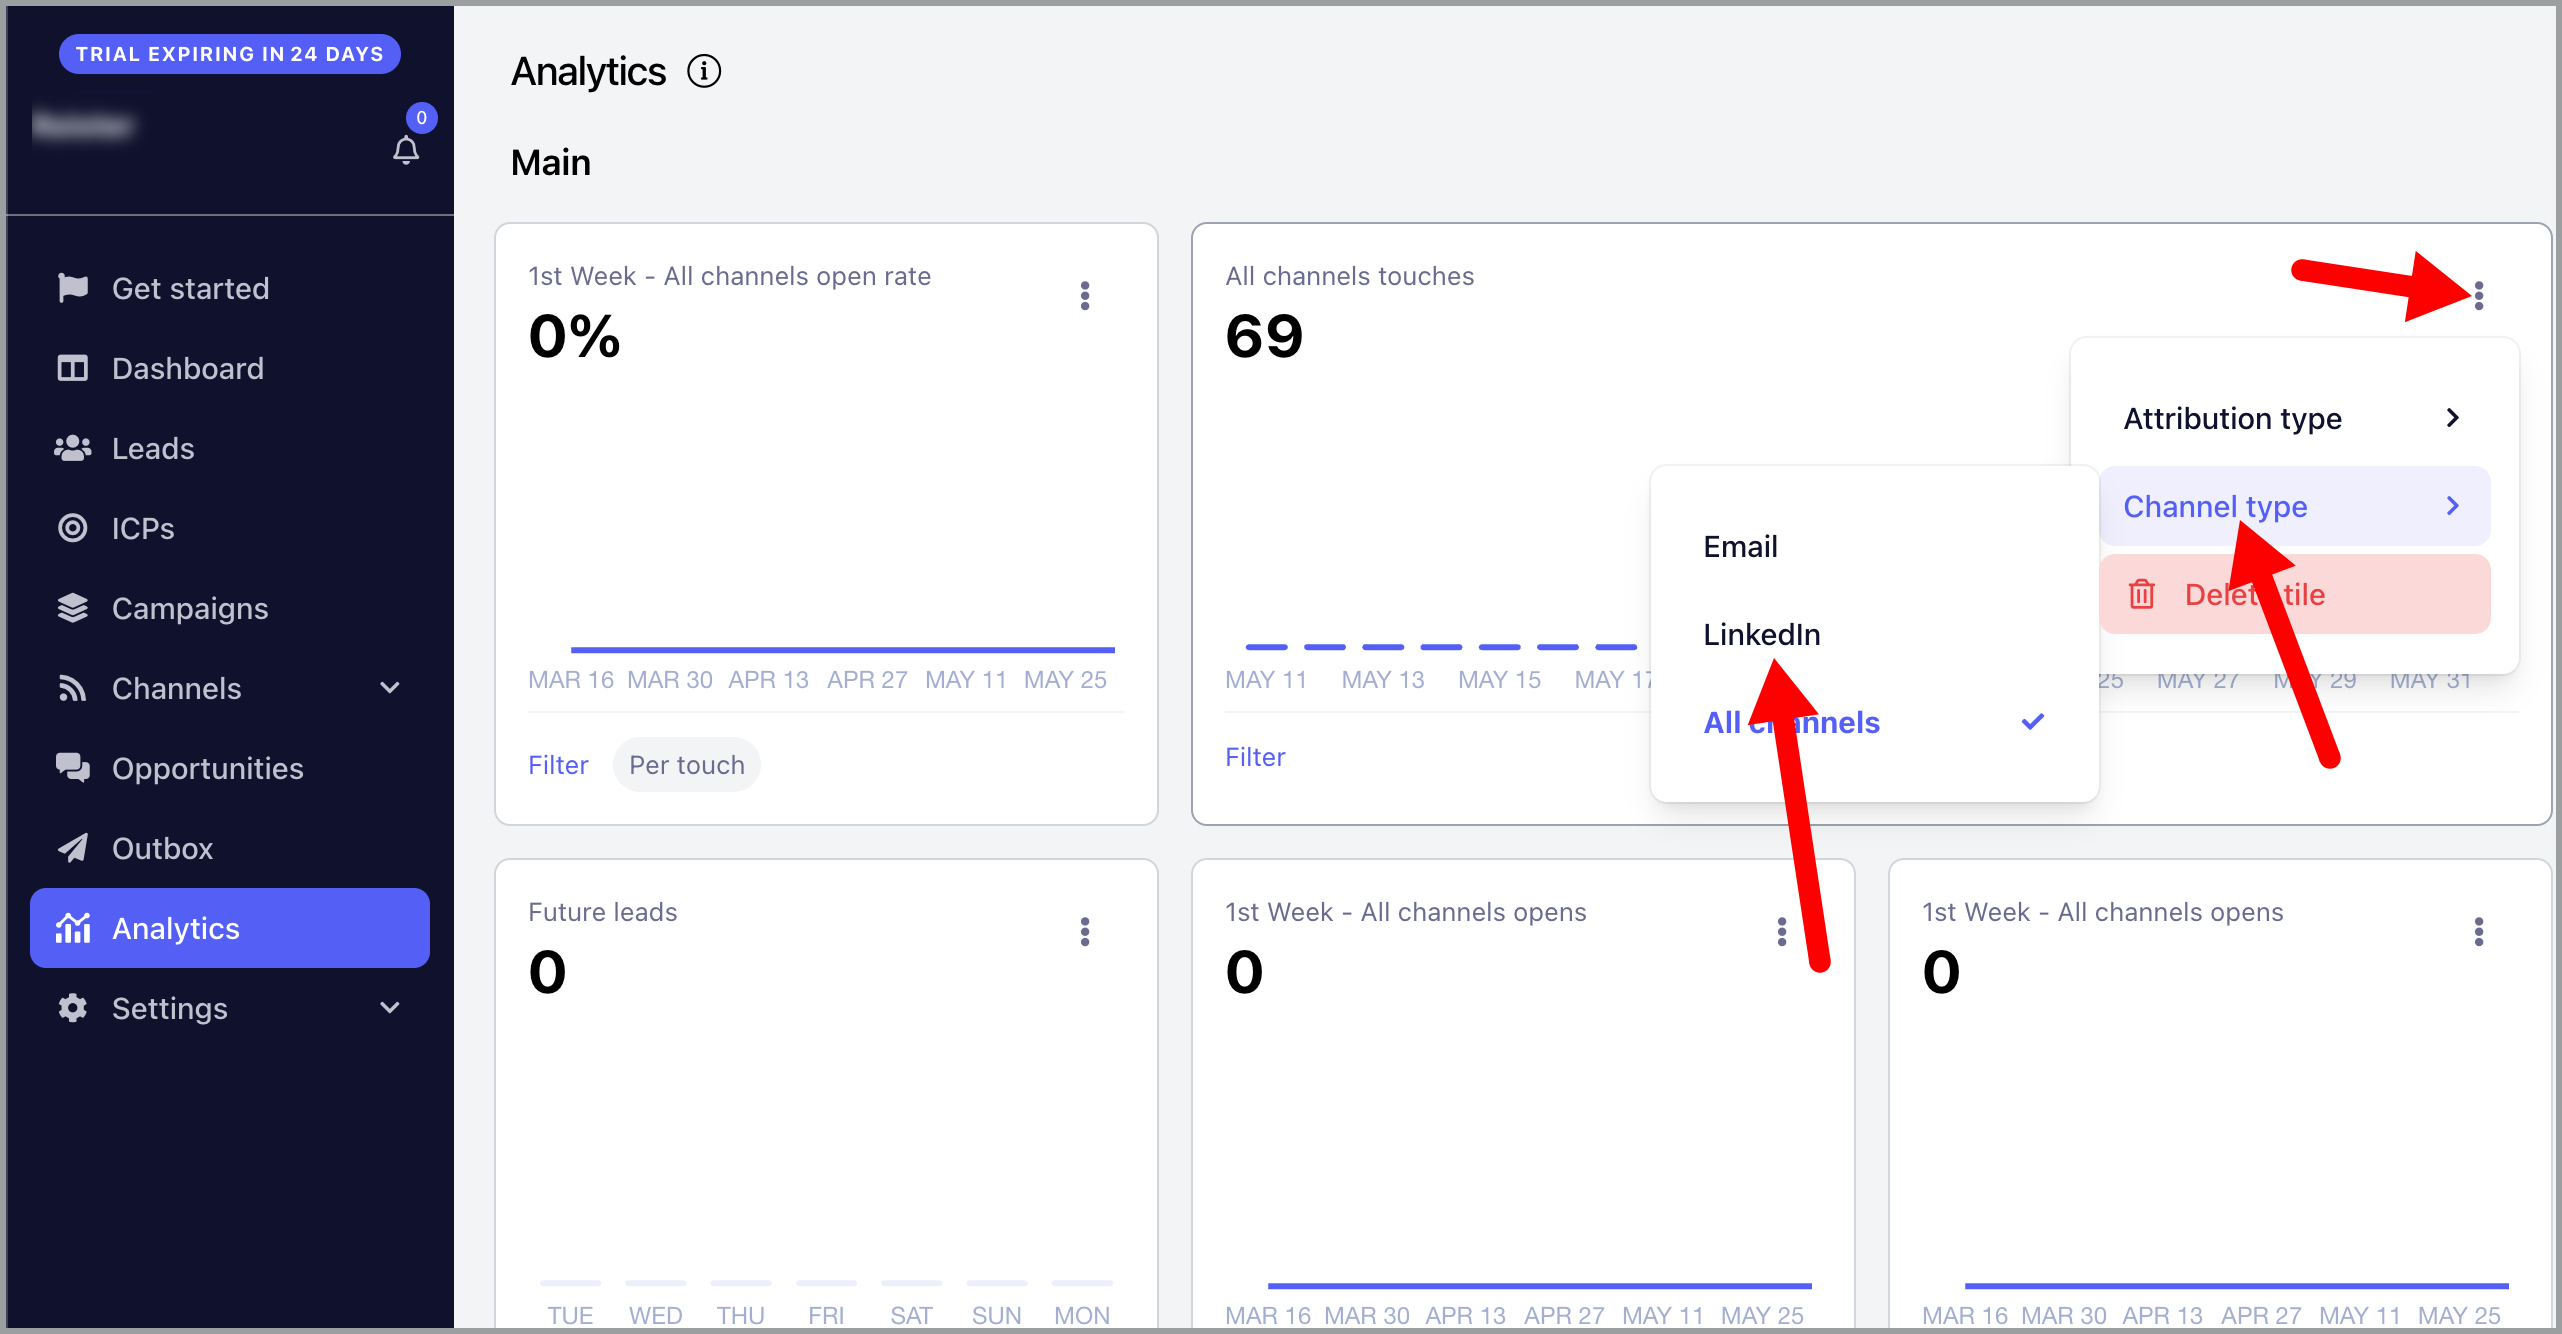
For connection requests, you can select the Acceptance Rate data type.
Can I See How Many Emails Have Been Sent Per User?
There is currently no option to filter stats by sender. You can look at the Outbox and filter by email account, but the Outbox only shows the last 30 days of sent emails.